The Just Energy Transition and the labour market in South Africa
Climatic stabilisation, as mandated by the Paris Agreement, necessitates a transition away from fossil-fuel based economic production and processes. In particular, the call to shift away from coal is crucial, given South Africa's substantial reliance on this energy source. The nation stands out as a larger CO2 emitter than the global average, with 86% of its primary energy supply and 85% of its CO2 emissions attributed to coal.[1]South Africa finds itself at the early stages of transitioning away from coal, but this is not devoid of socio-economic costs, as coal has a direct and indirect economic footprint.[2] Coal is a relatively cheap energy source, accounting for USD 3.8 billion and 3.97% of total merchandise exports, and is a source of employment and livelihood for many South Africans. Despite these socio-economic costs, delaying the transition could also prove costly, especially in light of evolving trade protocols that increasingly demand environmentally friendly alternatives such as electric vehicles or green steel.
In this article, extracted from a longer paper,[3] we provide a robust quantitative estimate of jobs – both direct and indirect – associated with the coal sector in South Africa. We also explore the labour market profile and characteristics of the individuals and households linked to the coal sector. In particular, we are interested in the size and shape of the coal labour market. Understanding the labour market implications associated with a transition is pivotal in shaping policy decisions linked to the just transition.
The South African coal mining landscape is characterised by its regional concentration. Of the 78 operating coal mines in South Africa, 65 (or 83%) are located in Mpumalanga, which accounts for 80% of national coal production. The spatial distribution of mines within the Mpumalanga province is further concentrated within local municipalities located in western parts of the province. Five municipalities – Emalahleni, Govan Mbeki, Msukaligwa, Steve Tshwete, and Victor Khanye – account for 70% of national coal production. The coal industry is further characterised by firm concentration, with five mining companies – Seriti, Sasol, Exxaro, Thungela, and Glencore –accounting for 77% of all coal production. Similarly, coal-fired power production is also concentrated within Mpumalanga, with 11 of Eskom’s 14 coal-fired power plants located in the province. These coal-fired power plants account for 70% of Eskom’s operating capacity.
There is a natural endogenous transition that is already underway by virtue of the lifespan of coal-fired power plants operated by the national utility. This is working in conjunction with the regulated transition to renewables. Half of South Africa’s coal-fired power plants will be retired within the next 15 years. This has implications both for the need for alternative energy sources and for employment in the coal mining and electrical utility industries.
The coal industry is a core component of the South African mining sector, accounting for approximately 20% of mining gross value added in 2019, up from 13% in 1993. Despite this, the economic contribution of the coal mining industry is relatively small, contributing only 1% of national gross value added in 2019.
However, coal mining provides an important source of export revenue in South Africa and has important downstream linkages to other industries, such as transport, petrochemicals and electricity production. The sector is a critical employer in the Mpumalanga province, where there are few other employment opportunities.
Existing publicly available data does not allow for the reliable measurement of employment across the entire coal value chain. The study thus focuses on measurable elements of the value chain, with particular focus on direct jobs linked to the coal mining industry, as well as a component of indirect employment linked to coal-fired power production. Existing estimates of employment suggest these two industries constitute 68% of employment along the coal value chain. The spatial dimension shows that coal mining and coal-fired power production is concentrated in the Mpumalanga province. As such, much of the labour market analysis is focused on this region.
The study uses data drawn from multiple sources. Individual-level data on workers is drawn from household survey data, including the Post-Apartheid Labour Market Series (PALMS), the Quarterly Labour Force Survey (QLFS), the Labour Market Dynamics (LMD) data, and Census data. Within these sources, we are able to identify employment in the coal mining industry and coal-fired power generation from 1994 to 2019. When estimating the population of coal workers, aggregated firm-level data is also available. These sources are the Statistics South Africa Mining Census data and the Department of Mineral Resources and Energy (DMRE) employment estimates.
The QLFS data poses a challenge of statistical representativity since it is designed to be representative at the national level, not at a provincial or lower spatial level. The disaggregation of the data in this way creates the risk of small sample bias, which can result in statistically noisy results.
We combat this bias in two ways. First, we use LMD survey data, which pools the QLFS data for each year, resulting in a larger sample size. Second, we use the Census data to support and cross-check the results we obtain from the LMD. A disadvantage of the Census data is that it is available only for 1996, 2001, and 2011. Therefore, it is necessary to use the later LMD figures to get more recent estimates. The LMD data is used to create a profile of the individual and job characteristics of the coal mining industry workers, while the Census allows us to profile the household characteristics of the coal mining sector workers.
In 2019, between 76 000 and 108 000 workers were employed in the coal mining industry. This represents approximately 0.5% of total employment in South Africa, and 19.05% of aggregate mining employment. The upper-bound estimate from Statistics South Africa’s firm level estimate is larger than the household survey estimate from PALMS, because the firm census measurement picks up outsourced workers and sub-contractors who may not identify as coal industry employees in the household surveys.
The quantification of aggregate employment in the coal mining industry indicates a consistent upward trend in national employment from 1994 to 2019. Employment in coal mining was relatively stable in the 1990s, followed by a strong upward trend from the mid-2000s until 2010. Although employment falls in 2015 and 2016, the trend proceeds upward from 2017. The coal employment in Mpumalanga province follows this trend, as the bulk share of coal industry employment is concentrated in the province. According to the LMD data, Mpumalanga’s share of coal mining employment has grown from 80% in 2011 to 86% in 2019.
The coal mining industry is a core employer in Mpumalanga and the local municipalities located in the western parts of the province. The industry accounts for approximately 5% of total employment in the province, while accounting for 19% of employment in Emalahleni, 15.3% in Msukaligwa, 13.7% in Steve Tshwete, 3.45% in Govan Mbeki, 9.4% in Mkhondo, 5% in Albert Luthuli, and 7% in Victor Khanye. It should be noted that these figures do not account for indirect employment through coal, such as retail and financial services.
When exploring the characteristics of coal mining workers, the 2011 Census and LMD estimates are reasonably aligned. The average coal mining worker is a Black African male, aged 25-44 years. The coal mining industry workforce is relatively youthful, with 51% being between 15 and 34 years. Furthermore, the average employee exhibits relatively high levels of educational attainment. Between 60% and 71% of coal industry employees have at least a complete secondary education.
In a decade and a half, when only three of South Africa’s 14 coal-fired power plants will be in commission, a quarter of the 2019 cohort of coal workers will be at retirement age (assuming retirement at 65 years of age). This is also likely to be an underestimate, since the retirement age of mine workers is 50-60 years for underground workers and 53-63 years for surface workers. However, the point is not that workers will not get replaced, but that new entrants will come in at lower wages. Thus, the cost of the just transition may possibly be reduced as high-paid retirees are replaced by entrants.
The coal industry is a semi-skilled intensive industry. Approximately 40% of employees are involved in craft and related trade occupations, while 35% are in plant and machine operator occupations. The implication is that we need to look to preserve these skills through matching into alternative sectors, which in turn will alleviate the burden of a pure fiscal solution to the just transition.
Coal mining industry jobs are predominantly formal sector jobs. Employees enjoy job quality indicators that are relatively favourable in relation to other formal sector workers (note: we are not able to measure job health and safety indicators). A large share (81%) has permanent employment conditions, such as Unemployment Insurance Fund (UIF) contributions (96%), pension contributions (80%), annual leave (89%) and medical aid (68%). Dependent on demand, job matching to alternative industries – such as manufacturing and construction – would result in adverse job quality outcomes for coal mining employees.
There are 46 100 coal households (households with at least one coal mining worker) in Mpumalanga. For the majority of coal households (58.9% or 29 500), a single coal worker is the only employed person in the household. A further 2 400 coal households have at least two coal mining industry workers. These households are completely reliant on coal industry employment income, making them vulnerable to the transition away from coal. More than a third (16 500 or 35.9%) of coal households have at least one other employed individual from another industry and/or the coal mining industry in the household. However, it should be noted that these other industries may be closely linked to the coal economy in the locality.
In terms of dependents, most coal households (70% or 32 500) do not have unemployed individuals in their households. Given the mean coal household size of 3.6, this suggests that the remainder of individuals in these households are not economically active. Approximately 13 500 (29.3%) of coal households have at least one unemployed individual in the household. Households with unemployed individuals also appear more likely to be single coal-worker households, rather than households with multiple coal workers.
Child and elderly dependency in coal households is low. More than half of coal households (26 200 or 57%) do not have any child dependents. Further, 18.5% (8 500) have one child and 24.6% (11 300) have at least two children. The mean number of child dependents in coal households is two. Finally, most coal industry worker households (43 900 or 95.4%) do not have any elderly dependents.
We further categorise households according to their reliance on coal mining industry income and the number of dependents in the household. We find that 17 600 (38.3%) of households can be considered less vulnerable. These are households with zero dependents, and 4 700 of these households have individuals employed elsewhere. However, 61.6 % (28 400) of households fall into the more vulnerable categorisation. These are households that have at least one dependent. A further 16 700 of these households are solely reliant on coal income.
Our study also focuses on the electrical utility industry in Mpumalanga. In 2019, employment in the electrical utility industry was estimated to be 30 481 employees in Mpumalanga. The average worker in the electrical utility industry is a Black African male aged between 25 and 44 years. Electrical utility industry workers are relatively more educated than the average formal sector worker in Mpumalanga. These workers tend to be employed in professional, technician, and plant and machine operator occupations – i.e. high- and semi-skilled occupations.
Electrical utility industry jobs are predominantly formal, and are characterised by high levels of UIF contributions, pension contributions, and various forms of leave. Additionally, the prevalence of unionised employees has increased over time, with 66% of employees belonging to a union in 2011, rising to 88% in 2019. The data suggests that, on average, electrical utility industry jobs have better employment conditions than the average formal sector job in Mpumalanga.
There are 11 200 electrical utility industry households in Mpumalanga. There is no substantial overlap between these and coal households. Although utilities households are not directly exposed in the event of the closure of coal mines or the retrenchment of coal employees, there is an indirect exposure, due to the relationship between coal mines and coal-powered stations. Slightly fewer than 8% of electrical utility industry households in Mpumalanga have one or more coal mining industry employee in the household. The vast majority of these (86.2%) are single electrical utility industry worker households with no other coal mining industry workers present. However, more than 40% of electrical utility industry households have at least one individual employed elsewhere, making these households less exposed to the closure of coal mines and the decommissioning of coal-fired power stations.
Similar to coal households, more than one-quarter (28.1%) of electrical utility industry households have at least one unemployed dependent. However, few of these households (only 6%) have elderly dependents, and just under half (47.6%) have one or more child dependents. As is the case with coal households, households with child dependents typically have more than one; the mean number is two.
Electrical utility households are also grouped according to their vulnerability. We find that 4 000 (33%) households can be considered less vulnerable. These are households with zero dependents, and 1 400 of these households also have individuals employed elsewhere (making them less vulnerable to adverse shocks). However, 67% (8 100) of households fall into the more vulnerable category. These are households that have one or more dependents, with 4 500 of these households being solely reliant on electrical utility industry income as they have no individuals employed elsewhere.
In terms of our quantification of coal industry jobs, we find that, in 2019, the industry accounts for 76 406 jobs nationally. Employment correlates with production, and thus the bulk share of these coal industry jobs – 66 252 or 86.7% – are located in Mpumalanga. The remaining 10 154 coal industry jobs (13.3%) are elsewhere in South Africa. A further 30 481 electrical utility industry jobs, linked to coal-fired power production, are in Mpumalanga. Thus, we estimate approximately 106 887 direct and indirect jobs linked to the coal value chain are in the province. The average worker across these two industries is Black African, male and young.
Using occupation-education categories, we have tried to break up the just transition challenge by dividing the coal and coal-related workforce into three analytical groupings – see Table 1. The first group (dashed black rectangle), defined as the no just transition challenge group, comprises workers with a post-secondary education qualification who work in high-skilled or semi-skilled occupations. Across the two industries, this group accounts for 29.28% of the workforce or 31 187 workers. Given the relatively high skill level of these workers, they are likely to find alternative employment opportunities, and thus the market may resolve the transition challenge for them.
The second group (solid black rectangle), defined as an intermediate just transition challenge, comprises those with, at most, a complete secondary education who work in high- or semi-skilled occupations. This group numbers 66 928, or almost two-thirds of the workforce (62.82%). Given the semi-skilled nature of this large group of workers, there is some uncertainty about the appropriate policy intervention. The more skilled workers may require a skills top-up intervention, which may facilitate a more successful match into alternative employment opportunities. The less skilled workers may require a special allocation from government into green jobs.
Table 1: Distribution of coal mining and electrical utility industry employment in Mpumalanga by occupation and education level, 2019
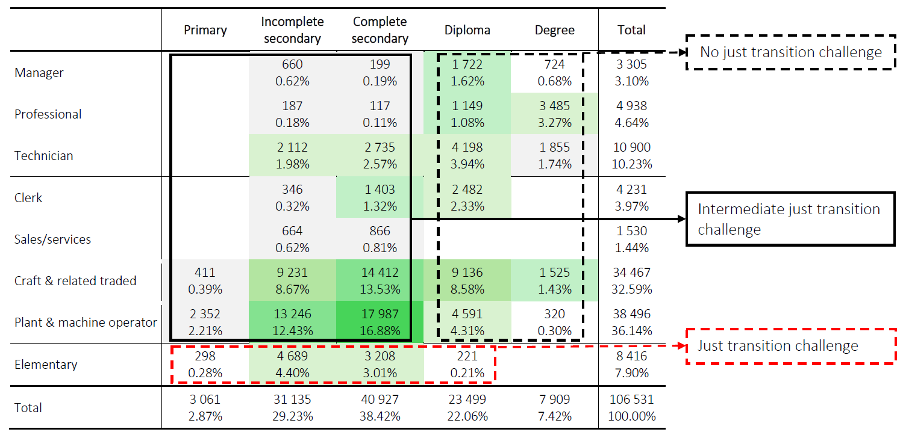
Notes: Levels (top figure) and shares (bottom figure) are reported for each occupation-education level combination (each cell). Total does not add up to aggregate number reported above due to omission of unspecified education category in data. Summation of all occupation-education level combinations equals total coal industry employment in South Africa and electrical utility industry employment in Mpumalanga. Increasing shares and levels of employment are represented by cells being shaded from lighter to darker shades of green.
The third group (dashed red rectangle), defined as the just transition challenge, comprises those engaged in low-skill elementary occupations. This group comprises 8 416 workers (7.9% of the workforce). These low-skill workers are unlikely to successfully match into alternative employment opportunities, and thus social protection in the form of income support, offers the best policy response for them.
A fourth group (not depicted in Table 1 but who would represent subsets of the aforementioned groups), defined as the retirement cohort, are those who are set to exit the workforce through retirement over the coming decade. They are aged between 55 and 64 and will probably naturally exit the industry. Another group, aged 45 to 54 years, may require early retirement packages. The former comprises 10 139 employees (9.5%), and the latter 19 212 employees (18%). The age distribution of the coal industry is skewed toward the younger cohorts, and early retirement interventions are likely to be less prevalent in the coal industry relative to the electrical utility industry.
Driven by both endogenous forces – natural closure of coal-fired power plants – and exogenous forces – regulatory policy shifting energy production toward renewables – the transition is set to continue, and likely accelerate. It is vital that appropriate policy interventions are devised in order to ensure a just transition. These initial empirical insights into the size and shape of the coal labour market can inform the scale and scope of these policy interventions. Given the heterogenous nature of the labour market, a diverse suite of policy interventions is likely to be required.
[1] Ritchie, Roser & Rosado, 2022
[2]Burton, J., Caetano, T. and McCall, B., 2018. Coal transitions in South Africa. Understanding the implications of a 2oC-compatible coal phase-out plan for South Africa.
Download article
Post a commentary
This comment facility is intended for considered commentaries to stimulate substantive debate. Comments may be screened by an editor before they appear online. To comment one must be registered and logged in.
This comment facility is intended for considered commentaries to stimulate substantive debate. Comments may be screened by an editor before they appear online. Please view "Submitting a commentary" for more information.