A growing informal sector: evidence from an enterprise survey in Delft
Introduction
This article presents the findings of a follow-up comparative analysis of micro-enterprises in the informal sector of one township. It compares the results from data gathered in the Cape Flats residential township of Delft South and Eindhoven (called Delft hereafter) in 2015 to comparable results from 2010/11 (see Charman et al., Econ3x3, March 2015). We focus on three areas of change: the total number of enterprises, the structure and composition of the informal sector, and the spatial distribution of micro-enterprises. We also highlight enterprise dynamics with regard to firm entry and exit in key sectors.
The study relates to a policy concern regarding the seemingly stagnant level of economic activity in the informal sector and the implication of this trend for communities with high levels of poverty and unemployment.
Background
The character of the informal sector remains elusive to researchers. National datasets on informal businesses may be of limited value to determine the size of the informal sector because, for example, many informal entrepreneurs may intentionally avoid statistical ‘capture’ by official statistical agencies as their businesses are not registered for tax and often operate outside the local bylaws; in addition, some of the goods sold may be extra-legal or illicit. Also, national statistical surveys such as StatsSA’s Quarterly Labour Force Survey (QLFS) tend to lose their validity at municipal level. Yet reliable area-level data are essential for city planners, for example, to respond strategically to changes in the township informal economy.
Our findings need to be seen in light of a recent analysis of QLFS data which indicate that employment in the informal sector in Cape Town (and in some other metropolitan areas) has stagnated or declined gradually in the last five years (Ranchhod et al. 2015: 16).
Method
Using the same ‘small-area census’ approach as before (see Charman et al., Econ3x3), we aimed to identify all existing micro-enterprises within an approximately three square kilometre area delineated as a census enumeration area in the 2011 Census. It comprises approximately 11 000 households and 43 000 people (StatsSA 2011). The geographical position of each business was logged by GPS. We also conducted interviews with business owners in key sectors using a semi-structured questionnaire. The research was undertaken from June to August 2015. The dataset was collated and all businesses were classified according to 36 enterprise categories (‘sectors’), consistent with the analysis of the 2010/11 data (Charman et al. 2015:10)
The number and sectoral distribution of enterprises
Whilst it appears that the residential environment has changed very little since 2010, the 2015 survey reveals that the number of micro-enterprise has doubled: whereas in 2010/11 our survey identified 879 distinct micro-enterprises, by 2015 the number of enterprises has increased to 1 798.
The change in the number of enterprises in various sectors is shown in Figure 1. We found that the number of enterprises had grown across all categories, apart from two: phone shops disappeared and the number of spaza shops declined by 14% (though it still is one of the most prevalent types of business).
Although it is possible that some enterprises went undetected in the initial survey, the growth in the number of enterprises (presumably in sectors with relatively low entry barriers) is remarkable. For example, the numbers for takeaways (up 364% over five years), street trade (776%), the sale of meat, poultry and fish (391%) and tailoring services (355%) reveal an astounding growth in the number of enterprises. Also noteworthy is the growth in the number of liquor retail enterprises (predominately of the very small micro-enterprise variety), which increased by 32% over the period – despite the risks of trading liquor illegally. (Note that, unfortunately, data on sales or turnover are not available from the survey; thus we are limited to measuring growth in terms of the number of enterprises.)
Figure 1: Number of micro-enterprises in Delft, 2010/11 versus 2015
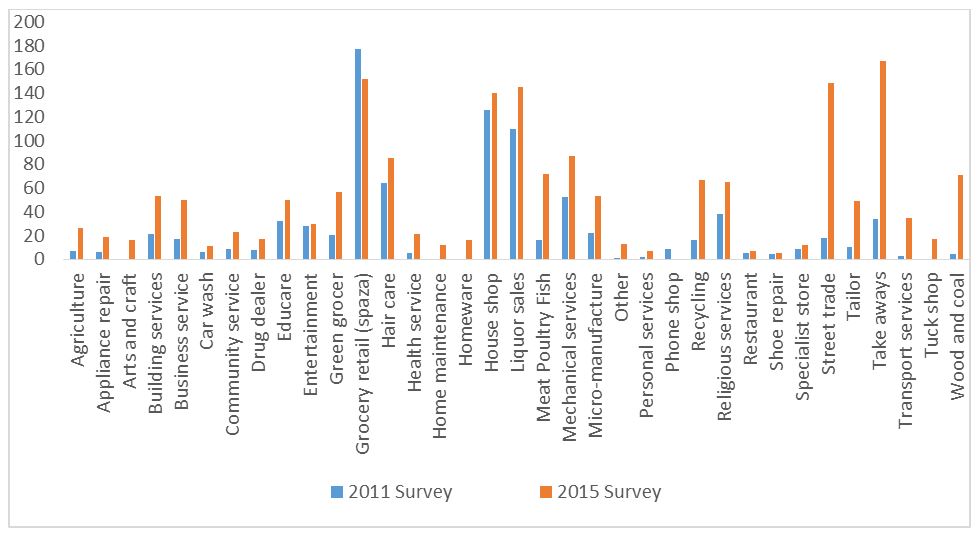
Table 1 shows the ranking and share of the top business types in 2015 compared to 2010/11. In 2015 the top five types of business were:
- food take-away shops (number: 167; share: 9.3%) – a huge increase;
- grocery retail, i.e. spaza shops (152; 8.5%) – a declining number and shrinking share;
- street trade such as clothing, chips and sweets (148; 8.2%) – also a huge increase;
- liquor sales (145; 8.1%) – a moderate increase; and
- house shops (140; 7.8%) – an increasing number but a shrinking share.
Table 1: Changes in economic structure: top-ranked sectors
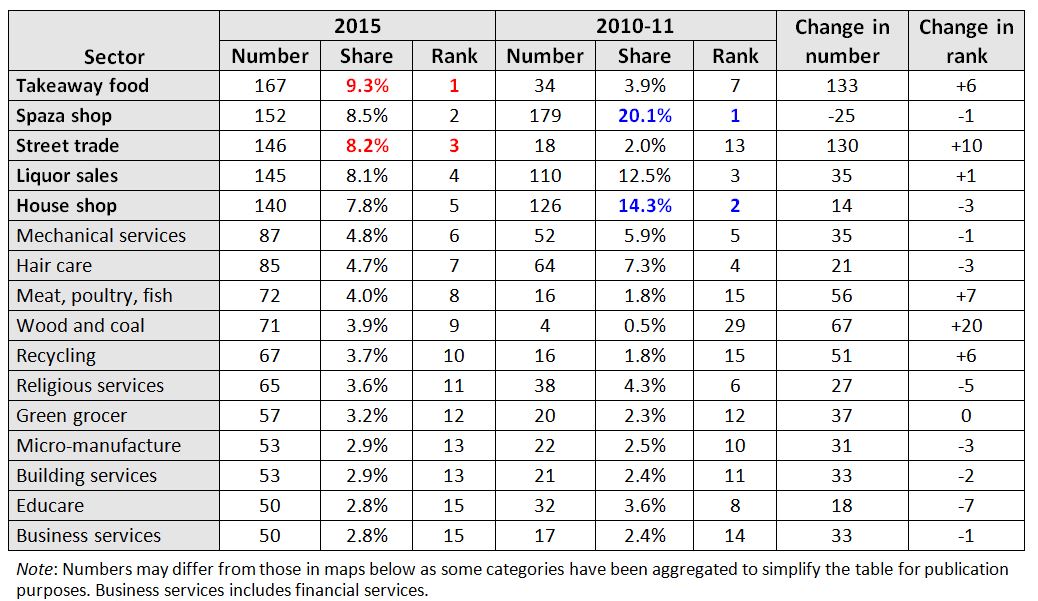
In 2010/11, spaza shops and house shops together (‘grocery retail’) accounted for more than a third of identified micro-enterprises, whereas in 2015 the combined share of grocery retail was down to 16% – mainly due to the numerous take-away food stalls that had taken over a large part of the food business. Nonetheless, on the whole, food, drink and groceries still dominate micro-enterprise activities in the Delft informal sector in numerical and proportional terms. (Street trade is the other big surprise, moving up 10 rank positions; wood and coal sales have also grown dramatically.)
The spatial distribution of enterprises
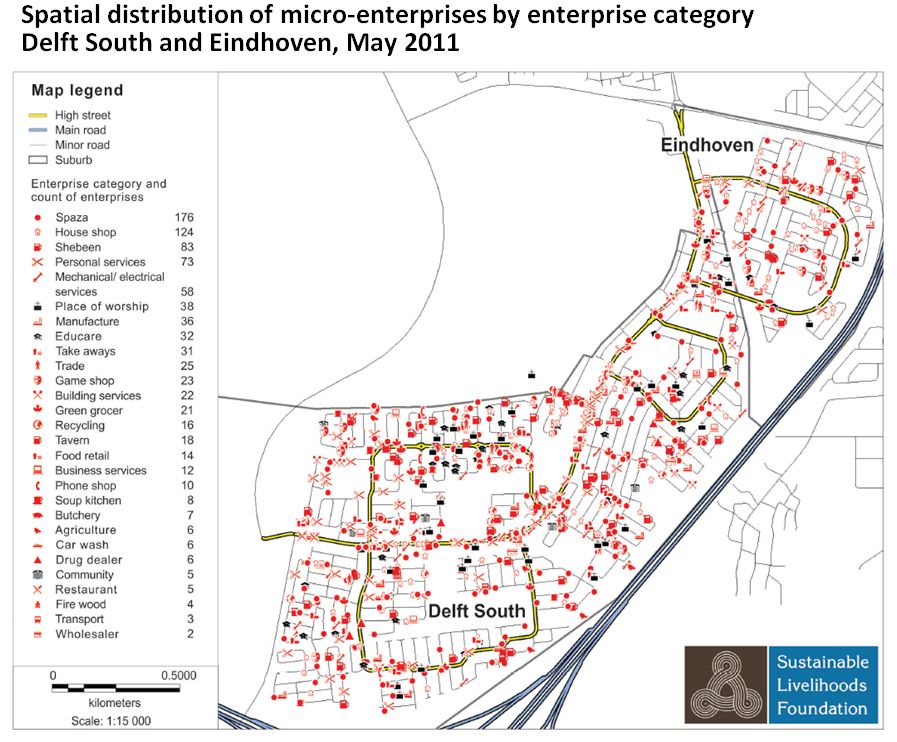
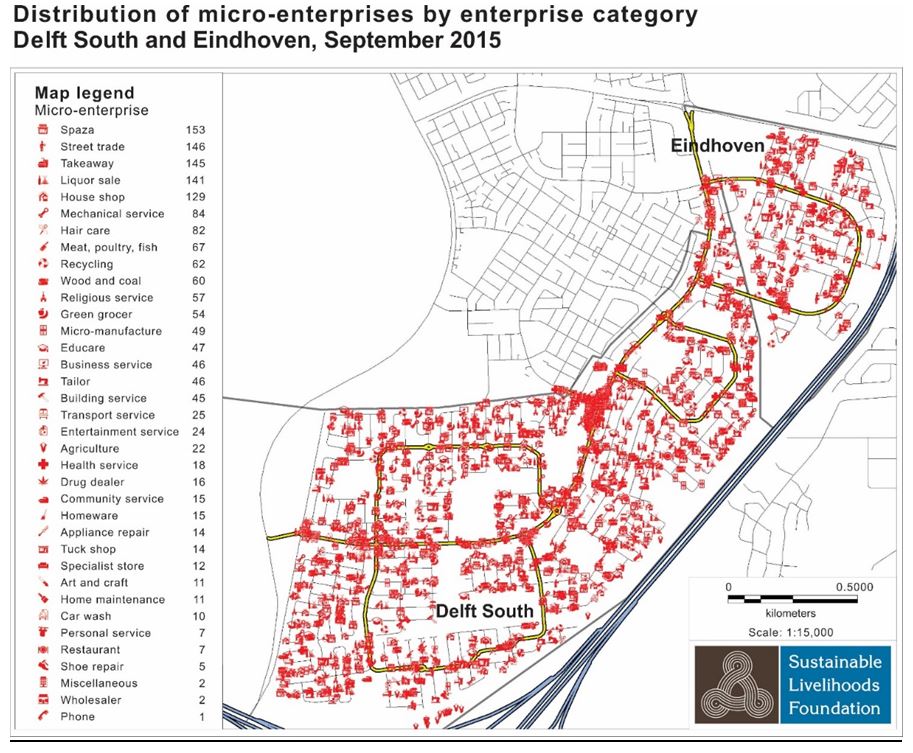
Maps 1 and 2 show the spatial distribution of these enterprises in the two years under survey. First, the overall increase in the number of enterprises in the period up to 2015 is evident. Secondly, the tendency has not abated for informal enterprises to be spread throughout the township, and in residential areas in particular.
Though a clear ‘high street’ can be observed visually, it is not the dominant spatial node for informal enterprises. In the 2010-11 survey, 42% of the identified micro-enterprises traded on the high street. In 2015 the proportion of high street business increased to 46.2%. While this seems like a notable increase, the figure is explained by the spike in the number of street traders (8.2% in 2015, up from 2% in 2010/11) in the 2015 survey. Apart from this, the evidence suggests that business activity in the high street has not intensified at a rate that is substantially greater than the growth of business the residential areas (contrary to our anticipation before the 2015 survey).
Map 1: Delft micro-enterprises 2010/11
Map 2: Delft micro-enterprises 2015
Enterprise longevity
Interviews on the longevity of businesses and related matters were conducted with a sample of 1 303 business owners. We found that 727 micro-enterprises have been established since the 2010/11 survey, with a significant number having been in operation for one year or less (for house shops this amounts to 38%; for meat/fish/poultry: 35%; for takeaways: 31%; for wood and coal: 51%).
On the other hand, 44% of the sample (576 businesses) have been running for four years or longer – and 20% for over a decade. The numbers imply that 65% of the 2010/11 business population of 879 have remained in business – suggesting a higher-than-anticipated rate of survival of informal businesses.[1]
The case of both spaza shops and liquor retailers reveals a new insight into firm entry and exit in the township informal sector. Of the 119 microenterprises selling liquor as either a primary or secondary activity in 2010/11, 71 (59%) had ceased trading by 2015, with merely 48 remaining in business. However, in the same period 85 new liquor outlets have opened – presumably to fulfil a growing local demand. Thus there was a lot of churning amidst overall growth in the number of liquor retailers.
In the spaza sector, of the 177 shops originally identified, 126 (70%) had ceased trading by 2015. The longevity of spaza shop businesses is shown in Table 2:
Table 2: Longevity of businesses in grocery retail (spaza sector)
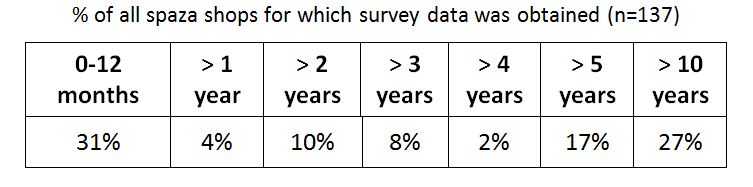
Only 53 spaza shops operated at precisely the same locality; in many cases the ownership had changed. (A mere 12 shopkeepers recalled participating in the 2011 survey.) Local residents reported that spaza shops were frequently bought and sold, and that the change of hands often occurred between entrepreneurs of different nationalities.[2]
What accounts for the growth in the number of micro-enterprises?
We identified evidence of enterprise growth in almost all business categories. It is evident that much of the new enterprise activity falls within the survivalist category, with entrepreneurship arising from the need for economic survival.[3] The spatial dynamics of this growth appears fairly evenly distributed across the research site, apart from a particular concentration on the high street, at the taxi rank and shopping mall.
The research indicates a number of factors that might have positively influenced microenterprise growth in Delft. These include:
- the role of non-resident entrepreneurs who have either bought out local businesses and/or created new businesses and who venture into underserved sectors;
- the emergence of business partnerships between informal and formal enterprises;
- the expansion of marketing opportunities through social networks and the provision of cultural products;
- the accumulation of business skills and knowledge; and
- external influences that benefit localised supplier/businesses.
Since 2010 the residential settlements adjacent to Delft have expanded. Over time both local and adjacent residents have sought to utilise the nearby opportunities (along high street feeder roads and within the Delft high street in particular). The main taxi artery route connecting Delft to destinations in the metropolitan region is in the high street and connects some 30 000 daily travellers through the site. This localised movement of people contributes towards the vibrancy and potentially fluid dynamic of the high street economy. It is likely that an increasing number of microenterprises have begun to exploit these growing local market opportunities.
Finally, an important (potentially critical) factor that contributes to the growth and survival of enterprises is the flexible quality of the informal sector that allows businesses to reposition themselves in terms of place and/or to refocus their services and products. We would argue that this flexibility potentially enables entrepreneurs to respond to changing market dynamics, whether these are shifts in pedestrian movements, the impact of crime or police raids.
Conclusion
Potentially significant positive entrepreneurial developments may be going underreported in official surveys. The quantitative change in Delft reflects that the number of informal microenterprises has doubled from 2010 to 2015, increasing from 879 to 1798 enterprises. Of these businesses, 576 have been trading for four years or longer and were around at the time of our 2010/11 survey. Whereas the researchers anticipated an intensification of business activities on the high street in particular, the data indicate that residential business activities have remained proportional.
The findings challenge the argument and evidence that employment in the informal sector is stagnant and has been ‘decreasing in Cape Town in the recent past’ (Ranchhod et al., 2015:19). The trend that we found (albeit in one township) of a massive informal-sector response to supplement household income casts some doubt on the QLFS dataset for the Cape Town metropolitan area.
Such a discrepancy, if shown to be valid for many more areas, would be a cause for concern for users of national surveys. Does this discrepancy exist because these economic agents are simply not captured in the official statistical enumeration process? This could occur either because they resist being recorded by a state agency or because the businesses are so small that they are overlooked by enumerators. Whilst we cannot answer this question, the situation in Delft at least shows that the trends in the informal sector may vary greatly between a local area and the national picture.
References
Charman et al. 2016 (forthcoming). Temporal and spatial enterprise change in a township informal economy: A resurvey of micro-enterprises in Delft South. REDI3x3 working paper.
Charman A, Petersen L & Piper L. 2012. From local survivalism to foreign entrepreneurship: the transformation of the spaza sector in Delft, Cape Town. Transformation: Critical Perspectives on Southern Africa 78, 47–73.
Charman A, Petersen L & Piper L, Liedeman R & Legg T. 2015. Small Area Census Approach to Measure the Township Informal Economy in South Africa. Journal of Mixed Methods Research.
Khambule E. 2012. On the changing nature of township economy: from spaza shops to shopping malls. Paper presented at Carnegie III Conference, University of Cape Town.
Liedeman R. 2013. Understanding the internal dynamics and organisation of spaza shop operations: A case study of how social networks enable entrepreneurialism amongst Somali but not South African traders in Delft South, Cape Town. MA thesis. University of the Western Cape.
Ranchhod V, Petersen L & James A. 2015. A consideration of the Cape Town informal economy through publically available datasets. Unpublished research report as part of the City of Cape Town Informal Economy Development Study.
[1] This assumes that these 576 micro-enterprises were present in Delft in 2010/11 (i.e. have not relocated from elsewhere to Delft).
[2] The case of the spaza sector has been extensively examined, in Delft and other localities (Liedeman 2013; Khambule 2014). The identified trend of immigrant pre-eminence in this sector is confirmed in the 2015 data. In 2015 of the 157 spaza shops, 82% were owned by immigrant entrepreneurs (with the great majority operated by employees). South Africans operate 83% of all the surveyed businesses though (n=1158), with other numerically important nationalities being Somalis (n=54), Ethiopians (n=34), and Zimbabweans (n=30).
[3] Survivalist is understood in the sense that the business is very small and run to supplement household income and is unsophisticated in the sense that it has no branding and little infrastructure, whist the business owner operates the business without a specific strategy to grow the enterprise.
Download article
Post a commentary
This comment facility is intended for considered commentaries to stimulate substantive debate. Comments may be screened by an editor before they appear online. To comment one must be registered and logged in.
This comment facility is intended for considered commentaries to stimulate substantive debate. Comments may be screened by an editor before they appear online. Please view "Submitting a commentary" for more information.