How high is graduate unemployment in South Africa? A much-needed update
Introduction
Is there any truth in the widespread view – which is informed to some extent by earlier studies or by a misreading of such studies – that graduate unemployment is a major and rapidly growing problem?
Since the mid-2000s, increasing references in the media to ‘high and rising graduate unemployment in South Africa’ have sparked public discussions and raised concerns about the functionality of the higher education system and the employability of its graduates.
However, a new analysis of the available data reveals that the findings of earlier studies are misleading. In a recent study (CDE 2013)[1] we evaluated the current extent and nature of graduate unemployment in South Africa.
Our findings have been much more positive than we anticipated. Graduate unemployment in South Africa is neither high nor rising at an alarming rate. In fact, considering the high levels of overall unemployment in the country, graduate unemployment is remarkably low. Yet widespread public misconceptions remain about the extent of graduate unemployment in South Africa.
The fallacy of high and rising graduate unemployment
A handful of studies from the previous decade have measured a strong rise in unemployment rates among graduates since 1995. Taken at face-value, they suggested that graduate unemployment rates had risen precipitously in the post-apartheid era and that South Africa faced a graduate unemployment crisis.
However, common methodological and definitional shortcomings in these studies make their findings and conclusions subject to several caveats.
First, there is a failure to adhere to a single, consistent definition of the term graduate. As a result, findings on graduate unemployment are often conflated with findings concerning students who have tertiary education, but who have not done a degree. This is a major source of incorrect conclusions.
For consistency, we will define a graduate as someone who has a bachelor’s or higher degree from a higher education institution (a university or a former technikon). People with non-degree, post-secondary certificates and/or diplomas (which may or may not have been awarded by higher education institutions) are not graduates, but may more appropriately be referred to as diplomates. Together, diplomates and graduates constitute the tertiary-educated (hereafter referred to as tertiaries).
Graduates, as defined as above, have far lower unemployment rates than diplomates. The relevant (OHS, LFS and QLFS) data shows that, since 1995 the broad unemployment rate among diplomates has consistently been between two and three times as high as among graduates (see figure 1 below). Clearly, lumping graduates and diplomates together as though they constituted a single, homogenous group would lead to an exaggerated perception of graduate unemployment. Yet, few studies (or related media reports) adequately differentiate between these two groups when drawing conclusions about apparent graduate unemployment levels and trends.
Secondly, all of the earlier research citing rapid increases in unemployment among graduates (and/or diplomates) in the post-apartheid era drew their conclusions from comparing only two data points – usually the 1995 October Household Survey (OHS) and one of the 2002-2005 Labour Force Surveys (LFS). Comparing graduate unemployment between only two points in time, spaced 7 to 10 years apart, ignores movements between those two points as well as the risk that one or both of these data points may be an outlier.
Moreover, one cannot deduce, from the fact that measured graduate unemployment levels apparently rose over the period, that graduate unemployment was on a (continuously) rising trend. As figure 1 (below) shows, broad unemployment rates among both diplomates and graduates actually peaked in 2001. By 2005 the broad unemployment rate for both had already been declining for some time; for graduates it had almost dropped back to its 1995-level.
A third limitation of earlier studies is that they failed to note the levels of uncertainty that underlie their empirical findings – in particular, the large confidence intervals which surround their reported point estimates of the graduate unemployment rate. (The larger the confidence interval, the less one’s confidence in the precision of the point estimate based on that sample.)[2] The large sample sizes in the labour force surveys generally lead to small confidence intervals (or bands) for overall unemployment rates, which consequently are rarely reported. But this does not apply to the much smaller sub-sample of graduates. The 95% confidence interval around the point estimates of the graduate unemployment rate has consistently been between 2 and 3 percentage points wide (see figure 1 below). This implies that observed changes in the estimated rate may have been small relative to the width of the confidence band.
And that, indeed, was the case: the estimated (broad) unemployment rate for graduates in 2005, for example, was not statistically different from the estimated graduate unemployment rate in 1995. Most of the earlier studies failed to note this.
The facts on graduate unemployment (updated and corrected)
None of the major earlier studies provides estimates of graduate unemployment beyond 2005. The information on which the public perception and popular quotes is based, is quite dated and, as it happens, incorrect.
As figure 1 shows, the current (2012) graduate unemployment level is not significantly higher than in 1996. Despite a significant increase in the recessionary period since 2007, graduate unemployment was still only 5.9% in 2012, having been 5.4% in 1996 – a change so small it is not statistically significant.
Figure 1: Broad unemployment rates for graduates, diplomates and ‘tertiaries’
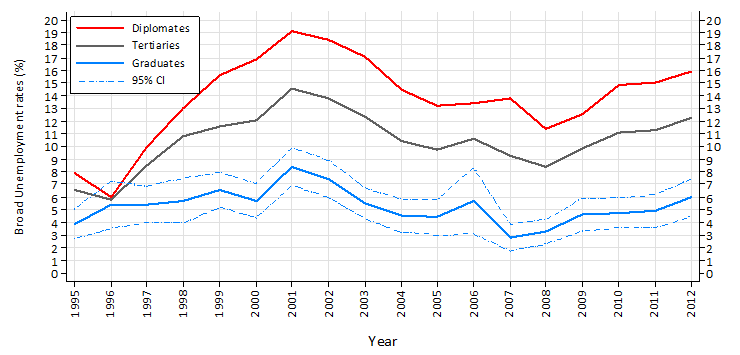 Source: Own calculations based on OHS 1995–1999, September LFS 2000–2007, QLFS 2008Q3–QLFS 2012Q3
The best available and updated data, properly scrutinised, fails to support any finding other than the one that the graduate unemployment rate in South Africa has been more or less constant since 1995 (although with some cyclical movement). Moreover, at 5.9% it is quite low when compared to, for example, a graduate unemployment rate of 6.2% in Europe in 2012 – and particularly relative to South Africa’s aggregate unemployment rate of approximately 36% (broad definition).
South Africa’s stock of graduates (properly defined) has grown rapidly over the past 15 years. In 1995 there were approximately 463 000 graduates in the labour force. By 2012 this has more than doubled to about 1.1 million. Yet, despite this significant influx of graduates into the domestic labour market, the broad unemployment rate for graduates remains below 6%. Of the approximately 1.1 million graduates in the labour force, only about 66 000 were unemployed (QLFS 2012, third quarter). That simply does not constitute a crisis of graduate unemployment. (For diplomates, though, the situation is different – but that is quite another matter.)
Are black graduates being absorbed in the labour market?
The rapid expansion of the graduate labour force after 1995 was accompanied by a dramatic change in the racial composition of graduates. In 1995 there were approximately 1.7 white graduates for every black graduate in the labour force. By 2012, this ratio had decreased to 0.9, largely due to the significant growth in the number of black graduates over the past 20 years. In fact, South Africa’s 23 public institutions of higher education now collectively produce significantly more black than white graduates every year. As a result, the number of black graduates in the labour force now exceeds the number of white graduates.
The number of employed black graduates has increased greatly since 1995. Table 1 shows that black graduate employment grew, on average, by 6% per annum over the 17-year period – from 145 000 in 1995 to 454 000 in 2012. Moreover, contrary to most expectations, the vast majority of this growth occurred in the private sector. While black graduates employed in the public sector more than doubled between 1995 and 2012, the number employed in the private sector increased more than four-fold and is likely soon to outstrip the number of publicly employed black graduates.
Table 1: Number of employed black graduates
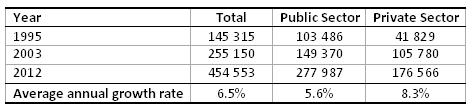
Source: Own calculations based on OHS 1995–1999, September
LFS 2000–2007, QLFS 2008Q3 – QLFS 2012Q3
Nevertheless, there are still large differences in the unemployment rates for white and black graduates. This is illustrated in figure 2, which shows that over the period 1995 to 2012, the estimated broad unemployment rate of black graduates has consistently been much higher than among white graduates, particularly in the late 1990s and early 2000s.
Figure 2: Broad unemployment rates for black and white graduates
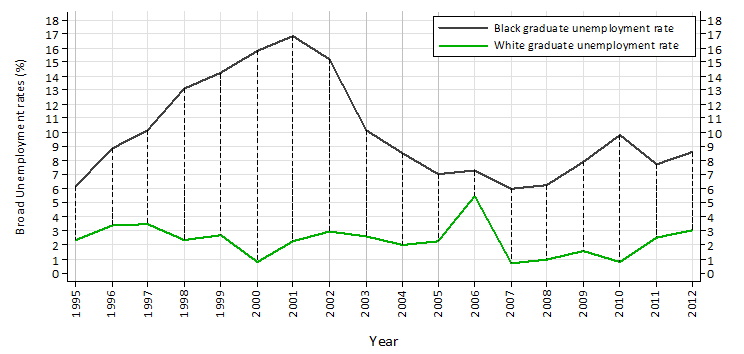
Source: Own calculations based on OHS 1995–1999, September LFS 2000–2007, QLFS 2008Q3 – QLFS 2012Q3
While the gap between black and white graduate unemployment rates has become smaller over time, the difference in broad unemployment rates – 8.6% versus 3.0% in 2012 – means that black graduates are still almost three times as likely to be unemployed than their white counterparts.
Despite these racial differences, however, the current (2012) broad unemployment rate for black graduates is still low when considering that the aggregate broad unemployment rate amongst the black population (for persons of all education levels) exceeds 41%. (By contrast, the aggregate broad unemployment rate amongst the white population remains just below 8%.)
Are some degrees or universities bad for graduate employment prospects?
From the existing data and research there is not much statistical evidence that either the type of degree acquired, or the university attended, leads to a greater likelihood of being unemployed for a graduate (although we still need better data and more research to understand these aspects fully). Unemployment rates are relatively low even amongst black graduates who currently are more likely to enrol for courses in the arts, humanities and social sciences and attend ‘formerly disadvantaged’ universities.
While the composition and quality of a degree may play a role in black graduate unemployment being higher than for white graduates, black graduates still experience lower graduate unemployment than in the European Union, for example.
From an outdated to an updated view: labour market prospects for graduates in South Africa
There is no evidence of a crisis in graduate unemployment in South Africa. The country’s graduate unemployment rate has not risen significantly between 1995 and 2011 and remains low at around 6%. Moreover, the number of employed graduates has grown and continues to grow rapidly, particularly in the private sector. Virtually all university graduates appear to find a spot in a skills-hungry labour market (though some degrees may be less easily marketable than others).
These findings are especially encouraging, given that South Africa is producing more and more graduates every year and that a growing proportion of these are black.
Our findings have many implications for policy. For example, the evidence on graduate unemployment provides no support for a policy that restricts skilled immigration in a country that experiences close to full employment of graduates and a shortage of people with many specific skills.
References
CDE (Centre for Development and Enterprise) 2013. Graduate unemployment in South Africa: A much exaggerated problem. CDE Insight. April 2013. http://www.cde.org.za/index.php/joomlaorg/2012-10-16-08-07-50/83-jobs-and-growth/403-graduate-unemployment-in-south-africa-a-much-exaggerated-problem
Van der Berg Servaas & Van Broekhuizen, Hendrik. 2012.Graduate unemployment in South Africa: A much exaggerated problem. Working Paper 22/2012, University of Stellenbosch. http://resep.sun.ac.za/index.php/research-outputs/stellenbosch-working-papers/wp2012/
[1] Our full report to the CDE is available on the ReSEP website (http://resep.sun.ac.za/). A shortened version has been released as a CDE study (http://www.cde.org.za/).
[2] A confidence interval around a point (or single-number) estimate of e.g. 5% shows how wide one has to go around the 5% estimate – e.g. from 3.5% to 6.5% - to be reasonably sure that the real unemployment rate is contained within the interval. The greater the uncertainty, the wider the interval. In Figure 1 there is a 95% probability that the actual unemployment rate has been within the band indicated by the dotted lines – but it could be anywhere within that band, not necessarily on the solid line.
Download article
Post a commentary
This comment facility is intended for considered commentaries to stimulate substantive debate. Comments may be screened by an editor before they appear online. To comment one must be registered and logged in.
This comment facility is intended for considered commentaries to stimulate substantive debate. Comments may be screened by an editor before they appear online. Please view "Submitting a commentary" for more information.