More financial aid is not the best way to close the racial gap in tertiary education
Introduction
South Africa’s relatively high rate of secondary school attendance for all races has failed to translate into corresponding high enrolment in tertiary educational institutions, with Africans and coloureds lagging behind whites by 30%. South Africa’s wide income disparities between the different races, coupled with the fact that post-secondary enrolment is closely related to income, suggest that a lack of funding for university and other tertiary studies may be a major cause of the relatively low tertiary enrolment rates among Africans and coloureds. Accordingly, one might expect that extending access to financial aid (loans) for would-be students – i.e. easing their credit constraints – would have a significant impact on enrolment for university and other tertiary education. Persistent calls on the government to make more funding available to prospective students through the National Student Financial Aid Scheme (NSFAS) reflect this expectation.
However, at the same time, researchers have pointed to the poor quality of primary and secondary schooling that leaves African and coloured children ill-equipped to enrol for tertiary education. This could equally be an important causal factor in explaining low enrolment rates – implying that, if policymakers wished to decrease the wide racial gap in tertiary enrolment, improving the quality of primary and secondary schools should be the first priority.
This article provides new insights from the CAPS data.[1] Using information gathered, in repeated surveys, on nearly 5 000 young adults in metropolitan Cape Town between 2002 and 2009, it scrutinises these issues to identify which of these factors are most important in explaining low tertiary enrolment rates. Perhaps surprisingly, the empirical evidence suggests that extending access to financial aid is unlikely to significantly reduce the racial gap in tertiary enrolment. A much greater impact would be made by improving the quality of educational outcomes at (primary and) secondary schools – especially those attended by students from poor socio-economic backgrounds and whose parents have low levels of education.
The puzzle: persistent racial gaps in tertiary education
Although the past decade has seen large improvements in the secondary school enrolment of all races,[2] enrolment at tertiary institutions remains very low for African and coloured youth. Between 2001 and 2007 average rates of enrolment at tertiary institutions were as follows:
Table 1: Average tertiary enrolment rates of matriculants 2001-2007
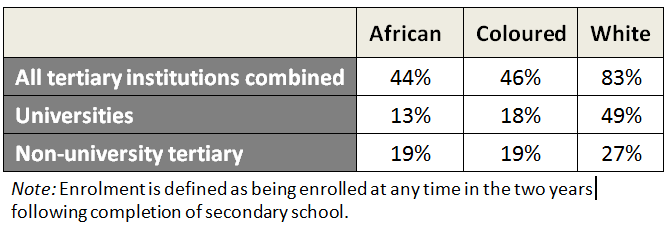
For all tertiary institutions combined, as well as for universities and non-universities in particular, enrolment rates for African and coloured youth are much lower than for whites. African and coloured students appear to face entry barriers at tertiary institutions, or are discouraged by some other factor. As noted, this may be because students cannot afford the tuition fees or obtain student loans, or because weak academic performance at secondary school means that they do not meet tertiary entrance requirements, or both.
The high monetary returns tertiary education in the labour market imply that matric learners should be clamouring to get some form of tertiary qualification. Relative to the average wages of a worker with matric, Africans can expect to earn 90% more if they have a post-matric qualification and coloureds 52% more (compared to 23% more for whites). The returns to a university degree are even higher, with earnings rising 141% for Africans, 98% for coloureds and 60% for whites (relative to average earnings of a worker with matric) (see Hofmeyr et al. in Econ3x3, 2013).
Household circumstances: differences in income and financial aid
In 2008 the median annual household income in South Africa was R29 780. In contrast, the average full cost of study (including tuition fees, books and accommodation) at traditional universities was estimated at R43 000 per year in 2008. Tuition costs at universities of technology (formerly known as ‘technikons’) typically are 20% lower than at traditional universities, but still are very high relative to average income levels in South Africa.[3]
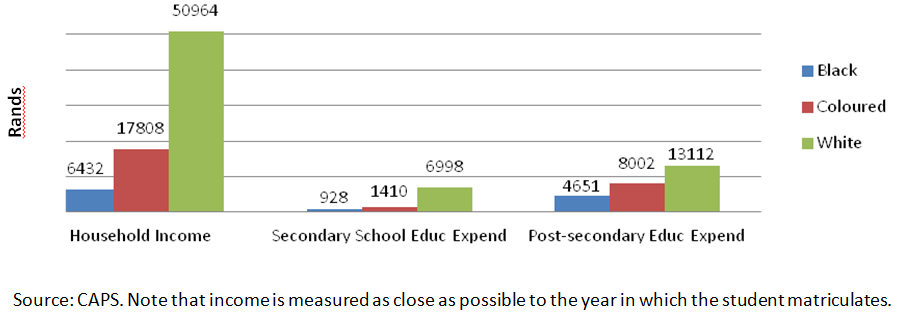
Figure 1 depicts South Africa’s high income inequality between the different races. On average, white households in metropolitan Cape Town annually earn more than double that of coloured households and more than eight times that of African households. This means whites are much better placed to afford tertiary tuition. Indeed, as figure 1 shows additionally, a white household’s average expenditure on tertiary education is one and a half times that of coloured households – and nearly three times that of African households. One would, therefore, expect affordability to be a constraint to tertiary enrolment for most students, unless such students can obtain a student loan.
Figure 1: Annual household income and educational expenditure across races
Although there is a range of financial aid options for students, demand exceeds supply and loan criteria often do not match the needs of poor and middle-class students. In 2008, only 15% of university students received loans or bursaries from NSFAS – which targets only low-income students.[4] The Eduloan scheme is a private programme that targets middle-income students, but the short-term structure of its loans makes them unappealing to many students. The stringent eligibility requirements of commercial banks restrict their loans to students from wealthier households, whilst the extremely high interest rates of informal money lenders make these loans all but unaffordable for anybody.
It appears that extended access to loans may assist some of the lower and middle-income students to overcome their credit constraints and thus to enter tertiary education – assuming these students are academically equipped for such an education. But is this the case?
Academic performance: differences in school quality and parents’ schooling
The primary and secondary educational experience of children varies widely between the different races. Significantly higher expenditure on secondary schooling by white households, compared to what is spent by African and coloured households (also shown in figure 1), indicates the better quality (and more expensive) schools that many white children attend. The educational attainment of the parents in a household also varies by race, with African parents averaging under 9 years of schooling whilst white parents average over 13 years. This puts African children at a further disadvantage, as more highly educated parents are better placed to help their children with school work.
Secondary school performance is also seen to be strongly correlated with income. Figure 2 shows the relationship between matric results and per capita household income. We divide the sample into low, medium and high per capita income categories and then plot the proportion of learners that achieve each matric score; the latter is expressed as a composite matric score based on subject marks. The low and middle-income students are bunched around lower matric scores (2.5 and 4 respectively) than the high-income students (score of 6).[5] Those from higher income brackets clearly achieve better matric scores on average. Learners from richer households appear to benefit from the higher expenditure on schooling by achieving better matric scores.
Figure 2: Distribution of matric scores across income brackets
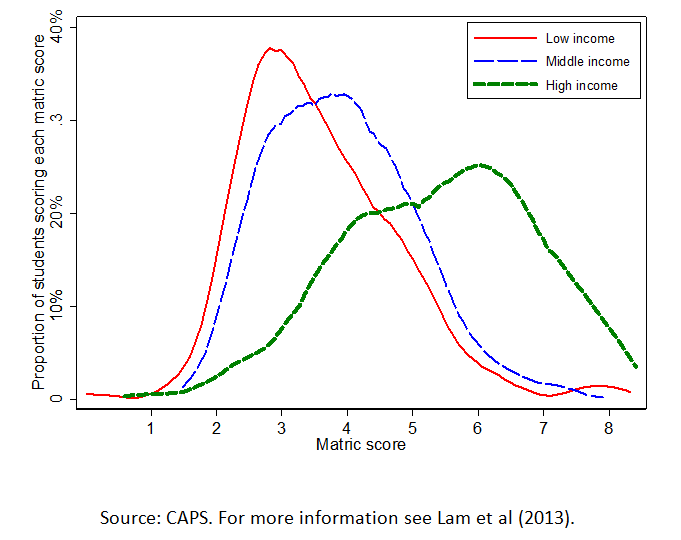
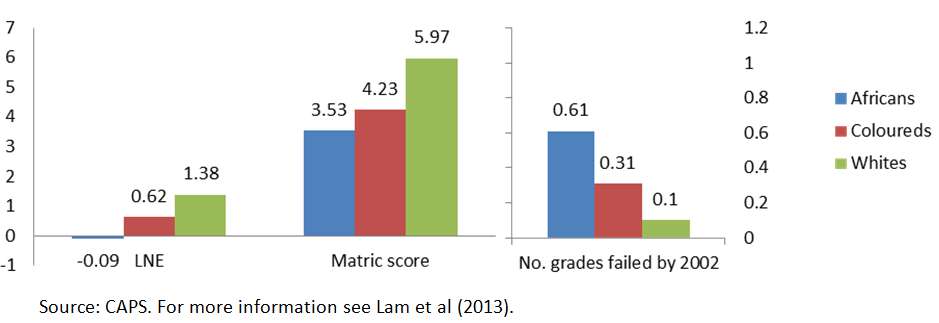
Figure 3 shows that academic performance at school differs markedly from race to race. African children consistently perform worse in the administered Literacy and Numeracy Evaluations (LNE), in matric scores and in the number of grades failed in the secondary school phase.[6] As secondary school education forms the basis for tertiary learning, this suggests that African and coloured children may struggle to be accepted into tertiary institutions.
Figure 3 Academic performance at school according to race in 2002
Why the large racial disparities? A statistical analysis
What is the main factor hindering tertiary enrolment – credit constraints or poor academic grounding at secondary schools?
Regression analysis enables us to disentangle the effects of these two factors, i.e. we include household income and high-school performance (both the matric and LNE scores). To do this properly, we also need to include other variables that could have an effect, such as parental education, gender and race. This enables us to identify the separate effects, directly and indirectly, of each of these variables on post-secondary enrolment.
For enrolment at universities the results are as follows:
- Parental education: A one-year increase in a mother’s schooling increases the likelihood of university enrolment of her child by 2.1 percentage points; a one-year increase in the father’s schooling increases that likelihood by 3.5 percentage points. This is probably because better educated parents act as role models, are better equipped to stimulate their child’s learning and development outside of the classroom, and are able to help with their child’s homework.
- High-school performance: A one point increase in the composite matric score for ‘weaker’ students (those with scores between 0 and 5) increases the likelihood of their university enrolment by 5%; a one point increase for ‘stronger’ students (with matric scores above 5) increases their university enrolment chances by a full 24.6%.[7] School performance has a huge effect on the likelihood of enrolment.
- Household income.[8] The direct effect of per capita household income on enrolment is nearly zero for students with the average income. (For the wealthiest group, a 10% increase in income has a very small (0.11 percentage points) positive effect on university enrolment).[9]
The last bullet is a surprise. If the effects of parental education and matric scores on post-school enrolment are properly accounted for, any effect of household income all but disappears. The first two effects dominate.
It must be kept in mind, though, that income can have indirect effects: higher-income households tend to spend more money on their children’s education and put them into better schools; such households also are more likely to be headed by better-educated parents. Therefore, some of the effects of parental education and matric scores capture indirect effects that originate from income. Nevertheless, it still means that household income only has an indirect effect, operating through longer-term aspects like increased parental education or sending children to better schools. Financial aid for prospective students cannot have an effect on university enrolment through such a channel; the likely effect of financial aid would be indicated by income having a direct effect on enrolment rates – which is not the case.
In addition, any effect of race on enrolment also appears to fall away – in fact, white students appear to be less likely to be enrolled at a university than Africans once the effects of all the other variables have been taken into account. This may indicate the impact of affirmative action in university admissions policies in favour of African students.
When the same statistical process is run for enrolment in other tertiary institutions (e.g. universities of technology and short-term certificate programs) the results are somewhat different. In this case there is a significant – though small – effect of income on enrolment: a 10% increase in per capita household income would lead to a 0.65 percentage point increase in the likelihood of enrolment. This suggests that easing the credit constraints facing the youth that wish to attend non-university institutions may help a bit to increase enrolment. But parental education and high-school performance still remains crucial.
Policy remedies? Results of a scenario analysis
What should policy makers do to address the racial gap in enrolment? Through a number of different hypothetical scenarios, using coefficients obtained in the regressions, Lam et al. (2013) demonstrate that efforts to ease credit constraints are likely to have a much more limited effect on enrolment rates than improving academic performance at secondary schools. This is shown in table 2. The first and fourth rows of the table depict (by race) actual university and non-university (i.e. other tertiary institution) enrolment. The additional rows depict the expected impact on enrolment in two different hypothetical scenarios.
In the first scenario, the negative effect of income disparities was removed by assuming that all households received the median household income of whites (keeping students’ academic ability and parental education constant).[10] The predicted result on enrolment was disappointing (see the second row of table 2). If all households were to receive equal incomes, African university enrolment would be predicted to be only 16.2% (up from 12.9%) and coloured university enrolment 22.2% (up from 19.9%) – compared to the 56% for whites.[11] This suggests that household income is not a major factor in explaining the low university enrolment rates amongst Africans and coloureds.
In the second scenario the effect of test scores – a measure of high-school abilities at exit – was scrutinised (third row of table 2). Raising all students’ test scores (both the LNE and matric scores) to the median test scores of whites (without changing incomes) has a much more dramatic effect. If all students were to have the same test scores when leaving matric, African enrolment in universities would be expected to be 53.4% (up from 12.9%) and coloured enrolment 49.4% (up from 19.9%) – compared to the 53% for whites. The racial gap in university enrolment would be completely eliminated.
Table 2: Simulated enrolment when the income or test scores of all are set equal to those of whites
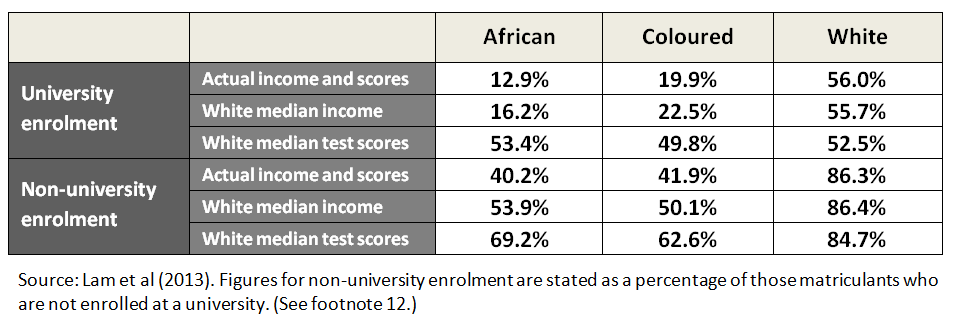
This suggests that efforts to increase test scores (i.e. to increase the end-of-school academic abilities of prospective tertiary students) would be a much more potent instrument to narrow racial gaps in university enrolment than efforts to boost the funding available for studies (household income and/or loans). It should be noted, however, that such equalisation of test scores is a huge challenge: raising the scores of all African students to the median white score would require that scores be increased by over four times on average. This would clearly require significant improvements in the quality of schools and educational support. Nevertheless, focusing on these improvements is likely to have the largest impact on university enrolment.
For enrolment at non-university institutions, the results are slightly different – the relaxation of credit constraints appears to have a greater effect on entry into these institutions than for universities (as seen in rows four and five in table 2). When all students are given the median white household income, African enrolment is expected to increase from 40.2% to 53.9% and coloured from 41.9% to 50.1% (against 86.4% for whites).[12] Raising all test scores to the median white test score raises the predicted African and coloured enrolment to 69.2% and 62.6% respectively (against 84.7% for whites). Nevertheless, differences in end-of-school academic ability continue to be the main limiting factor also for the non-university institutions.
Conclusion
The results provide strong evidence that, if post-secondary enrolment rates are to be equalised between the different races, the priority should be to improve conditions at primary and secondary schools – and especially those schools attended by students who come from poor socio-economic backgrounds. Perhaps surprisingly, household income and study loans, while not unimportant, do not have such a strong direct effect on the probability of enrolment.
Although this study was unable to test the effects of the current financial aid programmes directly – it could only isolate the effect of household income on enrolment – the empirical evidence suggests that extending access to financial aid is unlikely to significantly reduce the racial gap in tertiary educational enrolment in general. For non-university institutions the result is slightly different: the provision of additional financial aid is likely to lead to an enrolment effect greater than that for universities. Still, academic performance at secondary school continues to carry the greatest weight.
A final note: existing financial aid programmes may play an important role in making higher education, especially university education, accessible to low-income students. We have no way to tell what would happen to enrolment if current financial aid programmes were eliminated. While it appears that additional increases in financial assistance would have only a modest effect on enrolment, this does not mean that the current programmes do not have a large impact on overall enrolment and the racial gap in enrolment. But, a significant expansion of such programmes is unlikely to be very effective. Little progress will be made in reducing the racial gap in tertiary education until there is progress in reducing achievement gaps at school level.
References
Department of Higher Education and Training (2010). Report of the Ministerial Committee on the Review of the National Student Financial Aid Scheme. Pretoria.
Lam D., Ardington C., Branson N. & Leibbrandt M. (2013). Credit Constraints and the Racial Gap in Post-Secondary Education in South Africa. SALDLRU Working Paper 111, University of Cape Town.
Hofmeyr C., Brandon N., Leibbrandt M., Ardington C. & Lam. D. (2013). The Matric certificate is still valuable in the labour market. Econ3x3. October.
[1] The Cape Area Panel Study (CAPS) is a longitudinal survey that began in 2002 with a sample of 4 752 young people aged 14-22 in metropolitan Cape Town. It was repeated another four times, the last in 2009.
[2] The proportion of African youths with less than Grade 9 fell from 25.7% in 2002-2004, to 19.6% in 2008-2010; for coloured youth it feel from 31% to 18.5%.
[3] Figures obtained from The Department of Higher Education and Training, 2010, and the first wave of the National Income Dynamics Study (NIDS), conducted acrossSouth Africa in 2008.
[4] Department of Higher Education and Training 2010
[5] Approximately 25% of high-income students get a composite matric score of 6, approximately 33% of middle income students get a score of 4, whilst nearly 40% of low income students get a score of 2.5.
[6] The LNE was a test administered to all youth respondents in the Cape Area Panel Survey which was used by Lam et al (2013) in the analysis. It tests the respondent’s literacy and numeracy abilities.
[7] Increases in their LNE score yielded similar effects.
[8] Given the low asset base of many of the respondents in the sample, it is assumed that income constraints are a good proxy for credit constraints.
[9] The importance of including other key variables in the analysis is shown by the following. In a regression that focuses solely on the effect of income on university enrolment (i.e. assuming equal academic performance in high-school and equal education for parents), the regression results suggest that a 10% increase in income is associated with a 1.1 percentage point increase in university enrolment for students with average income. Once the effects of the other relevant variables are included, the apparent effect of household income disappears.
[10] Notably, this hypothetical exercise requires African incomes to rise 12 times, an overwhelmingly wide income gulf that would be extremely challenging for policymakers to fill in practical terms.
[11] Note that enrolment of whites fall in the hypothetical scenarios, as white median income is below the white average income (the results are similar for white median test scores as these are below white average test scores).
[12] Figures for non-university enrolment are stated as a percentage of those who are not enrolled at a university. Consider lines 1 and 4: 56% of white matriculants are enrolled at a university; of the 44% of white matriculants who are not enrolled at a university, 86.3% are enrolled at a non-university tertiary institution.
Download article
Post a commentary
This comment facility is intended for considered commentaries to stimulate substantive debate. Comments may be screened by an editor before they appear online. To comment one must be registered and logged in.
This comment facility is intended for considered commentaries to stimulate substantive debate. Comments may be screened by an editor before they appear online. Please view "Submitting a commentary" for more information.