Unpacking labour’s declining income share: manufacturing, mining and growing inequality
Introduction
The Marikana incident in 2012 and the protracted strikes by platinum miners, metal and postal workers in 2014 suggest that not all is well in the South African labour market. Articles in the financial press suggest that labour relations are precarious, with mistrust between business and labour leaders being widespread. This appears to be related to a larger problem of income inequality in South Africa.
The standard way of looking at income inequality is the Gini coefficient, according to which South Africa has, at 0.695, one of the highest in the world (World Bank 2014).[1] The Gini coefficient is based on household surveys, i.e. it is calculated at a microeconomic level. A related microeconomic perspective is to compare the salaries of CEOs to the average wages of employees in firms; ratios ranging from 95:1 to 725:1 were recorded for South Africa for 2013 (Preston 2014).
Another perspective on income inequality is a macroeconomic one, i.e. by looking at the share of a country’s total income that goes to workers (labour) relative to the share going to the owners of capital (owners of land, firms, shares, bonds, buildings, machines and so forth). Macroeconomic data, discussed below, indicates that labour’s share in total income – as measured by its share in gross value added (GVA) – has decreased, while capital’s share has increased significantly during the first two decades following the first democratic election in 1994 (all calculations were done using data obtained from StatsSA 2014).
Given that the ownership of capital, and thus the income from capital, is concentrated in fewer individuals than is the case with salaries and wages, a falling share of labour and a rising share of capital in GVA could contribute to a deterioration of income inequality. (For instance, the richest 5% or 10% of the population typically hold a much larger proportion of the total wealth and therefore receive a much larger proportion of the total capital income compared to the proportion of total salaries earned by the top 5% or 10% of salary earners.)
Of course, since this perspective focuses on the income shares of labour and capital, it cannot incorporate the (lack of) income of those who are unemployed or not economically active and who thus do not earn wages, profits or other forms of capital income. Nevertheless, a falling share of labour in income constitutes a major factor in understanding rising inequality.
This articles sets out to analyse the nature of the fall in labour’s share.[2] A follow-up article seeks to explain the reasons for and implications of this decrease.
Defining total income and labour’s share in it
On a macroeconomic level the total income of the economy can be calculated in various ways. The best-known measure of total income is ‘expenditure on gross domestic product’ (GDP), which calculates income from the expenditure side of the economy as the sum of consumption, investment, government expenditure and net exports. However, income can also be calculated from the production and factor income side of the economy. This yields what is conventionally termed ‘gross value added’ (GVA). (In terms of broad analysis, GDP and GVA are roughly equivalent concepts – the only differences between the two are taxes and subsidies on products and production.)
GVA comprises income flows to its two components: labour remuneration (‘compensation of employees’) and the gross operating surplus, which is the income received by capital (where ‘capital’ comprises both physical capital (machines, buildings, etc.) and financial capital (i.e. shares and bonds)). When the share of labour remuneration in GVA falls, that of capital, i.e. gross operating surplus, increases.
The falling share of labour in gross value added (GVA)
The share of labour remuneration in South African GVA (excluding agriculture) was 57% in 1993. As figure 1 shows, labour’s share subsequently declined to 49% in 2008, before improving to almost 53% (the black line in figure 1). However, if one also excludes manufacturing, which in 2013 constituted 11% of GVA, it appears that there has been no improvement in labour’s share in GVA since 2008 (the red line in figure 1). It has remained just below 50% up to 2013, having started at roughly 57% in 1994.
As mentioned above, the ownership of capital, and thus the income from capital, is much more concentrated than salary and wage income. Therefore, a smaller labour share is likely to imply a deteriorating income distribution.
Figure 1. Labour’s falling income share
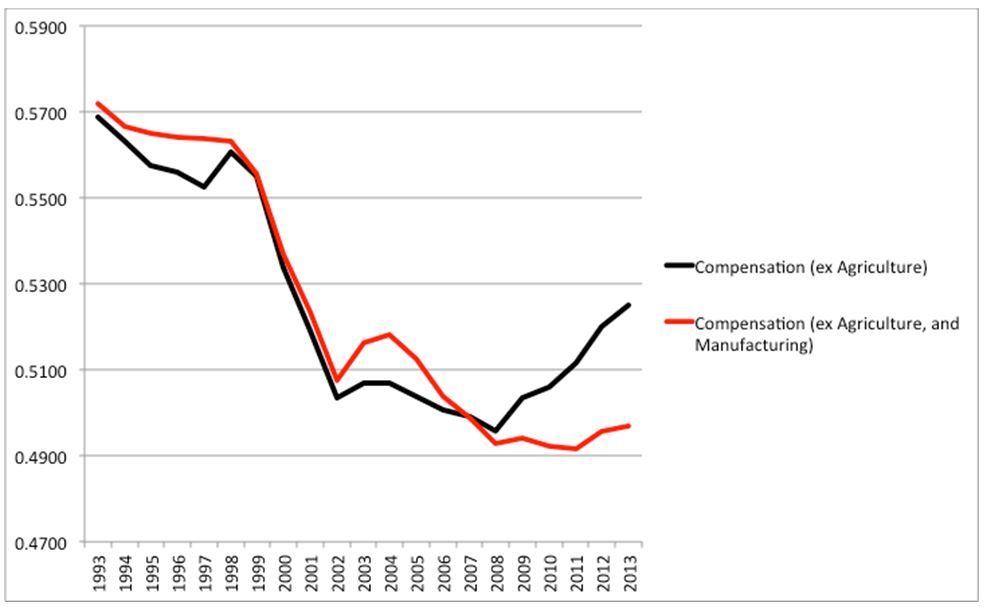
So one might ask what has happened in the manufacturing sector that could explain the divergence, in figure 1, between the red and black lines after 2008. As a percentage of total GVA, the manufacturing sector has been imploding, particularly since the start of the 2008 recession. South Africa has been deindustrialising since the mid-‘90s, but the speed at which this is happening has increased significantly since 2003. The share of manufacturing in the total GVA of the economy has shrunk from 21% in 1994 to 11% in 2013.
Figure 2 provides a further perspective on this trend. It shows, for the manufacturing sector, the real percentage changes in total GVA and in the amounts accruing to labour and capital. The grey line in figure 2 shows that the change in the manufacturing sector’s GVA has turned negative since 2008. None of the other sectors in the economy displays such deterioration. However, the South African manufacturing sector is not unique in this instance; Rodrik (2013) notes that several emerging market economies (including China) suffer from what he terms ‘premature deindustrialisation’.
Figure 2. Manufacturing: real % increase in GVA and the amounts
accruing to labour and capital
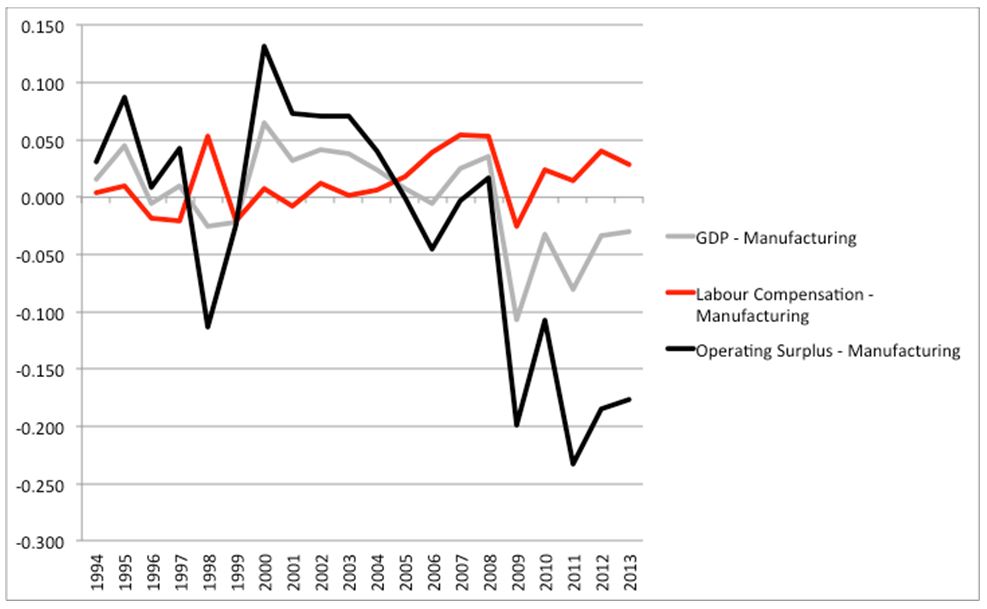
As far as shares in GVA are concerned, the fall in the manufacturing sector’s GVA has affected its profitability significantly. The black line in figure 2 shows declining percentage changes, and later negative percentage changes, in manufacturing’s gross operating surplus – the earnings of capital in the manufacturing sector have been deteriorating since 2000. Since 2008 the rand amount of GVA going to capital in the manufacturing sector has been shrinking in real terms by between 10% and 23% per annum. In contrast, in the entire period since 2000 the percentage change in the real income going to labour in the manufacturing sector has remained positive on average (i.e. in manufacturing, labour’s share has grown on average – which explains figure 1). Thus, in real terms those who are still employed in the manufacturing sector are better off and labour’s share in the manufacturing sector’s GVA has increased. However, this is a growing share in a sector that has been shrinking.
What does econometric analysis tell us?
An econometric analysis of the relationship between GVA, labour compensation and gross operating surplus confirms the patterns observed above.[3] The analysis shows that a 1% increase in GVA leads to a 1.12% increase in gross operating surplus. In contrast, a 1% increase in GVA leads to only a 0.68% increase in labour compensation. This confirms the rising share of capital, and the falling share of labour, in GVA.
What has happened internationally?
International studies (ILO 2013; OECD 2012) indicate that the decline in labour’s share in GVA is not unique to South Africa. Indeed, it has been a general trend in most OECD and many emerging market economies for the past three decades. In 26 of the 30 OECD countries, labour’s share has fallen (OECD 2012:113). While the median labour share in OECD countries was 66.1% in the early 1990s, it dropped to 61.7% in the late 2000s (OECD 2012:110; 113). ILO data show that the fall in labour’s share of income is not limited to OECD countries. If anything, it has been more pronounced in emerging market economies (ILO 2013:44).
A troubled sector: labour’s share in the mining industry
Given its prominence in the news since the Marikana incident, the mining industry deserves more attention. Figure 3 shows the real percentage change in the rand amounts going to capital and labour out of the GVA of the mining sector.
The significant labour market turmoil in the mining sector since 2012 (the year in which the Marikana incident occurred) can be observed in Figure 3. It shows that since 2012 there has been negative real growth in the rand amount out of GVA accruing to capital in the mining sector. During that same period there has been a positive growth in the amount out of GVA accruing to labour (the red line). A similar pattern emerges for the two recessionary periods in 1997 and 2009, as well as 2003 (when the rand appreciated significantly, thereby undermining mining income and profits).
Figure 3. Mining: real % change in GVA and the amounts
accruing to labour and capital
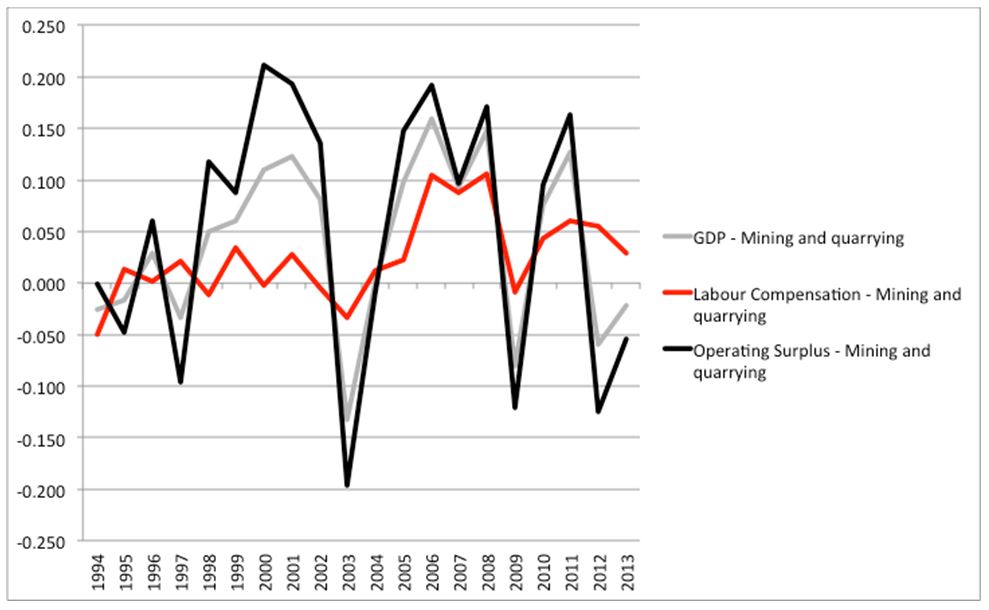
In contrast, during the commodity boom years of 2004-8 both the amounts allocated to capital and labour increased significantly in real terms. However, the amount allocated to capital increased by much more. Thus, during the commodity boom, labour shared in the resultant improved earnings, but not nearly to the same extent as capital.
For the full two decades a similar pattern emerges: on average the amount accruing to capital in the mining sector has grown at almost double the rate (5%) compared to that of labour (2.5%). Hence, the share of capital has grown steadily.
Conclusion
Labour’s falling share in total income has potential political implications. The ownership of capital – and thus the income from capital – is much more concentrated than salary and wage income. This means that, if labour’s share in total income decreases while that of capital increases, one might expect income inequality to deteriorate.
In South Africa income inequality is driven to a large extent from the bottom of the income distribution by the very high unemployment rate in the country. However, a falling labour share in total income means that the concomitant rising capital share in income adds to inequality from the top side of the income distribution. Micro survey data do not always pick up on the contribution that very high income earners make to income inequality simply because surveyors often do not gain access to those earning high incomes. However, the macroeconomic data on labour’s falling share suggests that we also need to understand what drives inequality from the top end of the distribution by finding out what drives the fall in labour’s share in total income. A follow-up article will explores what drives labour’s falling share in total income; it also considers policy options to address this situation.
References
Burger P. 2014. Wages, productivity, and labour’s declining income share in post-apartheid South Africa. Presidential Address, 2014 Annual General Meeting of the Economic Society of South Africa.
ILO (International Labour Organisation). 2013. Global Wage Report 2012/13. Wages and Equitable Growth. International Labour Office: Geneva.
OECD. 2012. OECD Employment Outlook 2012. OECD: Paris.
Preston B. 2014. Executive remuneration in South Africa. Online: http://www.mergence.co.za/media/11312/an%20analysis%20of%20executive%20r...
Rodrik D. 2013. The perils of premature deindustrialization. Project Syndicate.
Statistics SA. 2014. Gross value added data. Available from StatsSA on request.
World Bank. 2014. Fiscal policy and redistribution in an unequal society. South Africa Economic Update. The World Bank Group.
[1] This is the Gini value after taxes and transfers. At ‘market income’, i.e. before taxes and transfers, it is 0.771.
[2] This article is based on Burger (2014), Presidential Address at the Economic Society of South Africa.
[3] The analysis was done for the public and private corporate sectors, thus excluding agriculture and general government (government is excluded as it is not profit driven), as well as manufacturing due to its peculiar nature. The period analysed is the third quarter of 1996 to the fourth quarter of 2013, thus ensuring that the period considered only includes the years during which the labour legislation approved in 1995 applied. See Burger 2014 for more detail.
Download article
Post a commentary
This comment facility is intended for considered commentaries to stimulate substantive debate. Comments may be screened by an editor before they appear online. To comment one must be registered and logged in.
This comment facility is intended for considered commentaries to stimulate substantive debate. Comments may be screened by an editor before they appear online. Please view "Submitting a commentary" for more information.